Pages

01 September 2016

Debunking golden ratio shells (2)

(Continuation of part 1)

References

Everything I know about Nautilus Pompilius I learnt from these three knowledgeable sources:

[T] D'Arcy Wentworth Thompson, On growth and form (new edition, Cambridge University Press 1942)

[L] Neil H. Landman, Ontogeny of upper Cretaceous (Turonian-Santonian) scaphitid ammonites from the western interior of North America: systematics, developmental patterns, and life history. Bulletin of the American Museum of Natural History, volume 185 (1987), pp. 117-241.

[SL] W. Bruce Saunders and Neil H. Landman (editors), Nautilus, the biology and paleobiology of a living fossil (reprint with additions, Springer, 2009)

To verify our findings, or see for yourself (everything required will be at your disposal) you should download the marvelous free math tool Geogebra.


How I proceeded


1. I bought two halves of a Nautilus Pompilius shell (€ 11.95 a piece) at De Schelpenshop.

2. I put each half (in no particular position) on my CanoScan 9000F scanner, between two strips of graph paper on each of which I had marked by pin-holes the edges of two squares of 50 mm by 50 mm. These squares allow to detect and quantify any deformations caused by the scanning process. The raw results (TIFF files, 600 dpi) are here and here. I continued with the first one, because this one has more fine structure near the center. 

3. Using Preview.app I transformed the tiff file into PNG, then pasted the image into a Geogebra worksheet, with the lower left corner at (0,0) and the lower right corner at (10,0). (Arbitrary choices, to attach the image to the axes while zooming and moving it.) I had Geogebra draw perfect squares on top of my scanned pin-holed squares, and found that the most distorted square (top right) had deviations of less than 0.5 mm in 50, i.e., less than 1%. Given the intrinsic imprecision (thickness of the Nautilus lines, possible and unknown inclination of the plane of the cut), I decided not to interfere with the scanned image. I then cropped the image to the sole shell (here) and pasted the cropped png image as pic1 into a new Geogebra sheet, with its lower left corner at (0,0)  and its lower right corner at (10,0). 

4. The axis of coiling (the pole of the logarithmic spiral) matters a lot, because we're dealing with an exponential, and a small imprecision results in a large deviation. In [T, p.758], several methods to locate the pole are described, to which [L, p.166] added a new one. Yet in [SL] two expert authors locate the pole differently (compare p.386, fig.11 to p.107, fig.1).

Fortunately, Geogebra allows a new high-precision technique to pinpoint the pole, which is as follows. Choose any two points A,B on the shell curve and have Geogebra display a vector with starting point X, bisecting the angle formed by XA and XB, and with the geometric mean of these radii as length. Move X around until the vector points exactly at a point, say C, of the shell curve. Then we have XA/XC=XC/XB, which is characteristic of the pole X.

If the shell curve were a geometric object and a perfect logarithmic spiral, this method would unambiguously lead from any two points A,B to the pole X. But the thickness of the walls of the nautilus allows some variation in choosing points "on the curve" and deciding when the vector points at a point "on the curve". Also, moving A and B along the shell may lead to different locations of the pole. So one should regard the pole, critical as it is, as a fuzzy spot subject to some manoeuvrability.

I had Geogebra compute the angle α by which the image should be rotated around X in order to give the left endpoint of the shell the ordinate of X. (This angle reflects how the shell happened to be placed on the scanner, and doesn't mean anything.) 

I then defined a vector from X to the origin, translated pic1 by this vector (pic1' has the origin as pole), rotated pic1' (pic1'' shows the shell with its endpoint on the x-axis) and made pic1' invisible.


5. The equation r(t)=a exp(bt) implies that a=r(0) and that b can be determined from, e.g., r(4π)=a exp(4πb). I had Geogebra compute a,b from the points where the shell curve cuts the positive x-axis for the first time (Y, t=0) and for the third time (Z, t=4π). These points too are critical yet fuzzy.

In principle, the pole X and the points Y,Z define the logarithmic spiral unambiguously. In practice, I had to shuffle them around a bit before finding their optimal locations.


 The findings


Here's a snapshot of my Geogebra screen. Right: pic1 (not entirely visible) with the points A,B,X, left: pic1'' with the points Y,Z and the logarithmic spiral (yellow) obtained after some shuffling with X,Y,Z.


It is well known—and clearly visible—that the animal switches construction plans after it has built the last but one septum (separation between successive chambers). The very last septum is thicker, and much closer to its predecessor than all the preceding ones. I added a dashed line to mark—more or less—the point where the last regular septum is attached to the outer wall. Passed that point, a somewhat irregular fit might be expected. In our case, the irregularity observed is a slight bulge in, say, the first two thirds of the body chamber.

Here the Construction Protocol:


and here the entire Geogebra file.

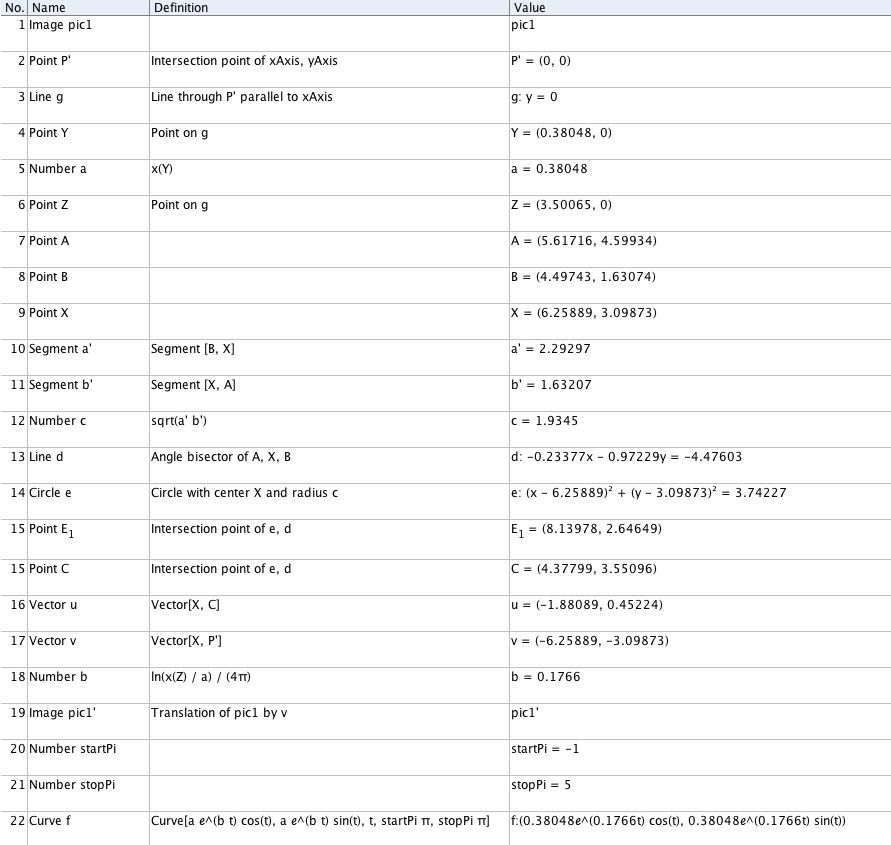
Precision being what it is (or not), our particular measurement yields

a growth factor f very close to 3 (slightly larger), 
a constant angle γ very close to 80° (slightly smaller). 

One defines the other, of course, because the former is exp(2πb) and the latter arctan(1/b).

That the radius is tripled after each complete turn was observed as early as 1838! In that year, Henry Moseley read to the Royal Society his paper On the Geometrical Forms of Turbinated and Discoid Shells (here), which contains on p.356 the statement that it is a logarithmic spiral in which the distance of any two of its whorls measured upon a radius vector is one-third that of the two next whorls measured upon the same radius vector. The figure 6 on p.371 shows

with ab is one-third of bc. So if the distances to the pole are: of a=1, b=3 and c=9, then ab=2, being one third of bc=6.

The angle too, of some 80°, is generally accepted as typical of Nautilus Pompilius, other gastropods displaying larger angles, between 80° and 85°. [T, p.791]


Summarizing, the Nautilus Pompilius canon in round figures (Nautila Pompilia centerfold, so to speak) is:


Remarks.

1. Measurements in [SL, p.389] seem to reveal that the first few chambers (built in the embryonic phase) are somehow different from the overall pattern, but I found no reason to skip these, and could start the spiral at -π.

2. In [SL, p.427] the irregularity predicted for the body chamber is that the last 20-30° is less curved than the rest. Our findings for this particular shell, cut as it was, were different.


Golden dreams


Nautilus, like the pyramids, is beloved by golden numberists because there are several impressive numbers, of dubious precision, to choose from. With some luck, you might strike gold, either φ=0.61803...  or Φ=1.61803..., or some suitable power of one of these. In
Matthew S. Lehnert e.a., The Golden Ratio reveals geometric differences in Proboscis coiling among butterflies of different feeding habits, American Entomologist 61 (2015), pp.18-26 (here)
we find, closely following the Parthenon (p.18), this artist's impression and caption (p.19):

the Golden Ratio, shown here in the shell of a nautilus, holds that the ratio of two parts (A and B here) is equal to the ratio of the larger of the two (A) to the whole (C, which equals A+B).

Assuming that the right endpoint of the segment marked B is the pole (precision seems to have been deliberately avoided), the claim A/B=Φ is equivalent to

f=1+Φ.

Unfortunately for the gullible among the American Entomologists, this claim is as blatantly wrong for the Nautilus as it is for the Parthenon: f is very close to 3, and nowhere near 2.61803... . But isn't fπ somewhere near 1.61803...? Or (which is actually the same thing) fπ/2 near √Φ? We leave you to explore these exciting possibilities.


Update 2018-01-18. My wild guess that 'fπ might be somewhere near 1.61803...' has materialized in the T-shirt Fibonacci on a Nautilus shell by Funmaths. Fibonacci is nowhere involved, but the dogmatic statement fπ = Φ is proudly displayed: in half a turn, the radius increases from 1.618... (decimals not mentioned) to 2.618... (decimals not mentioned). 


I used Geogebra (see below) to measure the distances given by Funmaths for their T-shirt pet, and found a growth factor IH/EF = 1.818..., nowhere near 1.618... In a real nautilus (like the one above that I measured) f2π  is very close to 3, hence fπ very close to the square root, which is 1.732... Sadly, Golden Dream Dogmas made it into the very math promoting business.


Here is what this funmath should look like:


*


21 August 2016

Debunking golden ratio shells (1)

Nautilus Pompilius is an octopus living quietly in the deep waters of the southwest Pacific. It floats around with tentacles trailing, which is from right to left in the still below. (Nice videos on Youtube.)


This living fossil is the last cephalopod with an external shell. If you carefully saw an empty shell in two, you see an intricate and most elegant spiral. Here is an artist's impression:


It's a very popular icon, and in the Sacred Geometry of the Universe department second only to da Vinci's Vitruvian Man. The Natural History Museum (here) refers to both at the same time. Of the nautilus shell in Sloane's collection we are told that
Its coil follows the golden ratio used by Leonardo da Vinci to create proportions pleasing to the human eye.
Since we know that da Vinci did not consider the golden ratio at all, there is every reason to distrust the golden claim for the nautilus shell. Did the Divine Architect really design his humble servant Nautilus—among all creatures great and small—with ruler and compasses? In order not to spoil your pleasure, we won't reveal the answer yet, just stay tuned.

The shell in its natural position. The beautiful shell of the Nautilus consists of successive chambers, up to 38 of them, coiled around an axis. We could begin by placing it in the natural upright position, like we would do with the skeleton of a fish, a sea horse or any living creature governed by gravity.

The animal lives in the lower and largest chamber of the many it has successively built while growing to maturity. The aperture of this last chamber deviates from the vertical by an angle α which is some 30° in rest, and oscillates from 15° to 45° in motion. The abandoned chambers in the upper part create buoyancy.

The logarithmic spiral. Most golden numberists consider the Nautilus shell placed in a strange position, and set in a rectangular frame. This is very artificial, because there is nothing rectilinear about the whole Nautilus. The natural framework to use here are polar coordinates: an angle θ (counted in degrees, radians or complete turns, called whorls) and the distance r to the center point. There is every good reason to suppose that the curve is (approximately and for the most part) a logarithmic spiral, given in polar coordinates by


 with a>0 and b>0 constant. 

There is nothing very mysterious about exponentials appearing in natural phenomena. If the rate of change of something is proportional to what there is, the differential equation modelling the phenomenon has the form y' = b y with b constant, and the solution has the form y=a ebx with a and b constant.

We'll consider a real shell in the next post, but first a few mathematical facts about the logarithmic spiral.


The only non-trivial statement is the fourth; for a proof, see here.

To describe the form of a logarithmic spiral, one can choose between


being: the constant angle between radius and tangent, the factor by which the radius grows on each quarter turn, half turn or complete turn.

(continued in part 2)


10 August 2016

Debunking golden ratio architecture (2)

This stop on the Golden Tour is casual and relaxing. You might say funny, because it doesn't get much sillier than this.

Today's claim is, that the façade of the Parthenon fits in a golden rectangle. For proof, one is usually served a front view of the building (with the upper triangle, which is all but missing, completed), with some golden rectangle as overlay. Most of the time, the fit is poor and lines are thick. But, every now and then, some details are provided. The picture below is accompanied by the specification 'that the bottom of the golden rectangle should align with the bottom of the second step into the structure and that the top should align with a peak of the roof that is projected by the remaining sections.'


Even if this claim were true, and even if the golden rectangle had any esthetic value (quod non), no meaningful impression whatsoever can be expected from a view consisting of a triangular roof, a rectangle, and two steps of four that are visible. The building was not even designed to be viewed from there, and the upper step is—by design—not even straight! To disprove the claim, it suffices to obtain reliable measurements of the Parthenon, including details such as the height of the steps. This is what one gets for the horizontal and the vertical dimensions of the proposed rectangle:

h = 30.604 m
v = 18.162 m (upper step to top of triangle) + 0.552 m (upper step) + 0.512 (second step) = 19.226 m

giving a ratio of v/h=0.62821... Wow! Weren't we expecting φ=0.61803...? And to say that this rectangle, no doubt, was selected among many other possible ones because it was the most 'golden'. It's 'approximately φ' all right, but everything is 'approximately φ' within a certain precision.

A secondary claim, often accompanying the primary one, is that the building abounds with (almost) golden rectangles. Here, we need not spend any time verifying, because the claim means nothing. There are so many rectangles to choose from that doubtlessly many of them will be 'approximately golden'. Here a fine selection offered for your entertainment.


When you're done, you might hunt throughout the Parthenon for rectangles displaying a 9:4 proportion. This time, your findings may even be meaningful, because this simple proportion did play a role in the design. (See here.)

Ah, lest I forget! I owe you a reliable diagram with Parthenon measurements. You can't beat Athanasios G. Angelopoulos, author of Metron ariston (unfortunately in Greek), who provides us with measurements up to a mm. Here two detailed views, front:


 and sideways:


Measures are in meters, but the additions in bold refer to a different unit of some 45 cm. Wherever possible, the author expresses his 'bold' measurements as mathematical expressions involving roots, powers, φ (which is (√5+1)/2, what we denote by Φ), π and e. You could do the same (describe real numbers as values of special functions, that is, not measure the Parthenon) by consulting Borwein's A dictionary of real numbers.


Good hunting!

*

Added April 22, 2017. The inventor of Golden Numberism is the 19th century German teacher and writer Adolf Zeising. He says so himself, because the title of his 1854 influential classic translates as
A new theory of the proportions of the human body, developed from a basic morphological law which stayed hitherto unknown, and which permeates the whole of nature and art. 
His weird and sometimes hilarious convictions (deeply rooted in Hegel's idealism) will be discussed separately. Here we restrict ourselves to the two pages (these) where Zeising introduces the Parthenon as the Golden Ratio crown jewel it has remained until today. In his image below we have transferred the vertical measure in red to its horizontal origin.


Zeising claims —the first one to do so— that "the" height (blue) and "the" width (red) of the Parthenon are in a golden proportion, and he provides us with the measures: height=65 German feet of some kind, width=107 feet. The measurements being up to one foot, we only know that the width is from 64.5 to 65.5 feet, and the height from 106.5 to 107.5. Hence, the ratio is between 64.5/107.5=0.600... and 65.5/106.5=0.615... Thanks, Adolf! Whatever the Parthenon ratio is by accident or intention, it's definitely not the golden ratio, because 0.618.... is outside the bounds obtained. Yet Zeising sees only an unimportant fraction of difference between this measurement and his ideal. In spite of the ridiculous number of digits in his models, he's less fussy when reality joins in. On p.310 he considers 11/18 (which is a lousy 0.6111...) as a reasonable attempt of creative nature to realise what he calls our law.

The actual measures given by Angelopoulos are: width=30.604m, height=19.738m if (as in Zeising's drawing) only three steps are taken into account, or 20.038m counting also the fourth step. The ratio is 0.644... resp. 0.654..., both way too big to be golden.

*


02 August 2016

Debunking golden ratio architecture (1)


Golden numberists see their beloved ratio

φ = (√5-1)/2 = 0.61803....

or its inverse
Φ =  (√5+1)/2 = 1.61803....

everywhere. Greek mathematicians knew it all right, because it is at the core of the regular pentagon, the regular icosahedron and the regular dodecahedron. Luca Pacioli was so impressed with its mathematical properties—theology is all he considers outside mathematics—that he called it the divine proportion. His contemporaries da Vinci and Dürer didn't share his enthusiasm though, and they avoided φ even in the rare case when they did need it. Both preferred empirical non-correct pentagrams to the geometrically correct ones based on the golden ratio.

Art and architecture are said to abound with φ's. Strangely enough, authorities on architecture have been unaware of this crucial fact for some millennia. The Roman architect Vitruvius wrote a ten volume classic on the trade, without ever referring to the golden number. Neither is φ to be found in any of the many renaissance treatises on architecture. (Overview in this 2002 paper.) No more so in Banister Fletcher's History of Architecture, (here) though it appeared in 1905, when golden numberism (originating in the 19th century) had already started its spectacular career. Sure enough, Le Corbusier and other modern architects did use it deliberately, but this is not another proof of the φ-myth, but just another consequence of it.

We will review the two most popular golden buildings:

The great pyramid

now, and the Parthenon later. Here we go!

*


What Herodotus did and didn't say.  

The Great Pyramid is the last standing of the wonders of the world, and is claimed to have been designed after the golden ratio. As proof of this, a text by Herodotus has been invoked, which, if it said what was claimed, would indeed imply this. But the only passage in Herodotus resembling what he supposedly said is in Book 2, 124 (here):  
Every way each face of its square is eight plethra, and the height equal.
To verify Herodotus, we will rely on the paper by the Cambridge classics scholar A.W. Verrall:
Herodotus on the dimensions of the pyramids, The Classical Review 12, No 4 (1898), pp.195-199 (here)
A plethron being 100 Greek feet, Herodotus gives the side as 800 Greek feet, which is approximately 776 English feet [Verrall p.196, 2nd column] or 236 m. This is remarkably accurate, because the actual side is something like 230 m [exact dimensions are considered below], and the use of the plethron as unit implies that Herodotus intended to give round figures. The actual height of the pyramid was some 147 m, and Herodotus is either completely wrong with his wild guess of 236—strange, given his accuracy on the side—or understands 'height' differently. Verrall explains that Herodotus understood this as being the 'ascending line of the pyramid', an easily observable physical length. In non-geometrical terms, we are told that the faces of the pyramid are equilateral triangles. In reality they are isoceles triangles with legs of 418 cubits and a base of 440 cubits. The error is some 5%—fair enough for a non-mathematical tourist who wanted to convey a rough idea expressed in plethra.
 

Measuring stone pyramids

Geometrical pyramids are easy to describe: the base is a square of a certain side, the apex is a certain height above the midpoint of that square. For stone pyramids, things are a little trickier. Their giant blocks of stone make measuring difficult, and they are severely damaged by history. Most have lost their outer casing, and several (among which, the Great Pyramid) have lost their top too. Several have a rectangular (non square) base, and one peculiar pyramid had a midcourse correction: the slope of the faces was changed abruptly, probably for fear it was too steep and might collapse.

The most reliable measurements of (even incomplete) stone pyramids with a square base are: the side a of the base and the angle α of the faces with the base.


From a and α, the (intended) height follows by h=(a/2)tanα.

The Egyptians had a peculiar system of measuring angles. Their seked was the horizontal distance needed to rise 1 cubit, i.e.

For the conversion: 1 cubit = 7 palms, and 1 palm = 4 fingers.


Also, they expressed non-integers in fractions with numerator 1, except 2/3 and 3/4 for which they had specific symbols. A palm being 4 fingers, one would expect a preference for the fractions 1/4, 1/2 and 3/4 in sekeds.


False precision, again


The pyramid of Khufu (Cheops), rightly called the Great Pyramid, is perfectly aligned and built with extreme precision. It has several measurements to offer, and strange relationships are seen to emerge if the right combinations are chosen with the right precision. In this respect, the great pyramid is no different from the human body. Thus, both π and φ have been discovered in the great pyramid. Historians of mathematics agree that this cannot possibly have been intentional, because Egyptian mathematics was not that highly developed. (See here and here.) Yes, magnificent buildings, from pyramids to Gothic cathedrals, have been created by builders using nothing but extreme skill and crude rules of thumb.

As for measures, one should not deduce anything from a single pyramid, no more so than from a single human body. Mark Lehner's comprehensive 1997 book on pyramids contains a table (p.17, here) giving measurements of 35 pyramids.


Five are unfinished (marked purple), four don't have a square base (orange), and nine have dimensions—base and/or height—lacking or not stated with certainty (green). This leaves us with a fine sample of 17 duely measured pyramids (yellow). There are 18 slopes to be considered, because yellow #2 is the pyramid with one slope for the lower part and another slope for the upper part. Our table below shows the remaining ones, ordered after slope. The numbers 1-18 indicate the original places in the yellow sublist above.

It is not clear which of Lehner's data are primary and which have been calculated. Most angles are given up to a second (like 52°7'48''), some up to a minute (like 42°35'), and a few up to a degree (like 52°). This seems to reflect different degrees of precision in measuring the pyramid as it stands today. Stone pyramids, however skilfully constructed, are never mathematically perfect, and the four faces need not have the same slope. The final figure for the Great Pyramid, for instance, is obtained by taking the average of several measurements of several faces. (See here the relevant pages from the magnificent book by Herz-Fischler, 2000).

To deduce the intended seked from the measured slope is still a different problem, and it may even have been when the pyramid was freshly finished. One can easily imagine that a minute difference in some basic template might accumulate to a final difference of a few meters. In the table above, we see that Teti and Pepi II have b=78,75 and h=52.5, while Niuserre has b=78.9 and h=51.68. The first two are identical and the third one, if not also physically identical (with apparent divergences due to the intrinsic imprecision of the measurements) was clearly intended to be identical. Yet the two slopes differ by more than 1°. The same happens with Senwosret III and Amenemhet III: same base, a height difference of just 3 m, yet slopes differing by more than 1°. Hence, it seems unjustified to distinguish slopes that differ by 1° or less. For all we know, they may have been designed after the same seked. Adding to this some millennia of physical deterioration, the conclusion is as follows: 
It is not easy for us to recognize the proportion originally intended by measuring existing buildings whose walls are frequently distorted by setting and destruction, certainly resulting in errors of calculation of one finger or more. [Here, p.12]
This does not, in any way, contradict the fact that the pyramids were built with unbelievable precision. But two architects, separated in time and place, having set their minds on the same seked, will probably end up with pyramids with slightly different slopes and different heights. The orientation of the base square and of the internal shafts must be perfect if the astronomical meaning is to be preserved, but the overall slope, let alone the final height, must not.

Taking this into account, here are our 18 angles (measured with a precision not given) and the seked as it was probably intended. The lower bound for the angle ('from') corresponds to the displayed seked plus 1 finger (i.e., +0.25), the upper bound ('to') to the seked minus 1 finger (i.e., -0.25).


If you think an error of 1 finger per seked is exaggerated, feel free to do your own exercise, for instance allowing an error of 1° in the angles. Note that a seked of 5½ palms gives rise to an angle of 51.842°, very close to the measured angle of Khufu's Great Pyramid which is (give or take a little) 51.844°.


A mystery

Now, where has the mystery gone? If you reject both the limitations of Egyptian mathematics and  the bounds on precision, you may feel inclined (hmm) to compare the measured slope

tan(51.844°) = 1.27278...
to
4/π = 1.27323...

and if you are in addition of the mystical kind, even to

√Φ = 1.27201...

Mystery at last! Why an architect would want to design templates for his workmen after the proportion 
or after a number (π) that cannot even be written with roots, nor geometrically constructed, now that's a mystery.


This said, even without any added 'mystery', the pyramids are a baffling achievement and a remaining tribute to the human mind as it was some five millennia ago. These days, we're closer to the dark ages again, and we must hope that civilization survives.

* *

Next stop: the Parthenon!


31 July 2016

Debunking golden ratio navels (2)

(Continuation of part 1)

Fake precision


How precise can N/L be measured? We need to know this before we can distinguish the irrational number φ=0.61803... from simple fractions like 3/5=0.6 or 5/8=0.625.

Both for L and N, we turn to medical experts. Osteoporosis specialists need precise height measurements in order to assess height loss in their patients. In 2005, Osteoporosis Update (here, pp.4-5) described tools and techniques to be used for accurate height measurement. We learn from it (p.5) that the precision error in height measurement is surprisingly large (up to 3.0 cm), that the clinically relevant threshold is a precision error less than 2 cm, and that the average of three separate measurements, recorded to the closed mm, is to be registered. Surprising indeed! There has been some internet debate about Albert Einstein's height, which has been given by Swiss authorities as 171.5 cm on one occasion and 175 cm on another. Both may have been equally right and perfectly in line with Swiss precision. Osteoporosis Update even suggests to measure height at the same time of day, to reduce diurnal effects!

For navels we have to consult plastic surgeons. In this paper, dealing with young adults, we learn that there are several forms of navels, and that they extend vertically over several centimeters. The average round female navel in this sample has a diameter of 3 cm, but they may extend vertically up to an unexpected 5 cm. (Note that we deal with facts, not esthetics.)

It follows that it would be unreasonable to claim L or N with more precision than ±1 cm. These bounds are definitely underestimated. Measuring a navel's height, for instance, is technically more involved and indirect than measuring total height, and sucking in the belly or breathing heavily has a noticeable effect.

For a person of "175 cm", with a navel at "106 cm", let's agree that we know that N lies between 105 and 107, and L between 174 and 176. This implies that N/L lies between 104/176 (which is 0.59090...) and 106/174 (which is 0.60919...). These bounds differ by 0.01828..., and this exceeds the difference φ-3/5=0.018.... Therefore, such a measurement would not distinguish one from the other.

In the sequel, whenever N/L is presented as a number with three decimals, one should take care to add '±0.009'.


Modern statistics (1)


We could only find three experiments worth reporting. First we consider
T. Antony Davis and Rudolf Altevogt, Golden mean of the human body, The Fibonacci Quarterly 17, No 4, 1979 (here).
The paper is very flawed, as we intend to show. Two entirely different samples are investigated: German school children of both sexes, and Indian young men (Calcutta).


As for precision, we are told (p. 341) that the measurements were done with a set-square and a vertical pole marked in centimeters. Inspecting the results recorded with three decimals, there is room for some suspicion.  


The authors record A,B,C,D,E hoping to recover the golden mean—announced in the title—from A/B and/or B/C and/or C/D and/or D/E. With some luck, C/D and D/E would turn out to be identical, because that's exactly what the golden ratio means. It's not clear what mystic properties were expected from ratios involving B (distance from nipples to top of head) because this physical measurement is highly dependent on gravity, and—as everybody knows—evolves with age. Anyway, these are their findings, with some miscalculations corrected in red.


GT = German bisex sample, tallest quarter
GS = German bisex sample, shortest quarter
G = German bisex sample
GG = German girls
BG = German boys

IT = Indian young men, tallest quarter
IS = Indian young men, shortest quarter
I = Indian young men.

Strange! The entry D/E for German boys (for example) is not the average of the individual values of D/E, but the average of D divided by the average of E. For comparison: instead of the average of 1/2 and 1/3, which is 5/12=0.416..., we would be given (1+1)/(2+3), which is 2/5=0.4. Not a single N/L is provided, only these (strangely defined) averages, which range from 0.611 to 0.636. We feel highly uncomfortable about this procedure. 

Anyhow, if the intrinsic imprecision of ±0.009 is taken into account, nothing relevant is seen to emerge, but you can judge for yourself.


It's 'approximately φ' all right, but everything is 'approximately φ' within a certain precision. My own guess for would be:

N/L = 0.62 ± 0.01

The justification is that 31/50 (0.62) is both simple and precise enough, and 0.01 is about the right precision. The guess is empirical, and intended for Homo Sapiens (all sexes, races and ages) as is. After all, Man was not designed by God according to some intricate plan, but he's an evolved quadruped. It's not clear why the navel would miraculously divide the length head + body + one hind leg, strictly aligned according to some remarkable, let alone divine, proportion.

The navel is hardly ever on the midline, but predominantly to the left of it (here and here p.9 and p.10), females have lower situated navels than men (here, p.10) and it sinks to a lower position as age advances (here, p.1).

The best we can hope for is some empirical relation holding statistically for the right gender, race and age.


Modern statistics (2)


Next, this contribution to Journal of Recreational Mathematics, vol. 24 (1992), pp.26-29. Being "recreational", the paper is not to be taken too seriously, and the secondary information surrounding the experiment is the usual crap quoted from unreliable sources. Concerning precision, we are only told that measurement error was a ticklish problem. The golden truth to be uncovered was 1/φ, being 1.61803... The average for the 161 male students was 1.654 and for the 158 females 1.646. Hence, the navels measured (admittedly with low precision) are statistically situated below the golden one, and closer to da Vinci's navel height (which would give 5/3=1.666... here) than to the golden expectation.


Modern statistics (3)


Finally, this worksheet of the University of Colorado, Department of Mathematics, Fall 2010, Math 1310, CSM. Data are restricted to only 30 students, and nothing is told about sex or race. Again, it is 1/φ, being 1.61803..., that should turn up. This being a classroom exercise in statistics, it would be unreasonable to expect anything precise, and L/N (the reverse of N/L) is given with only two decimals. The values range from 1.50 to 2.01, with

mean value = 1.629 ;  standard deviation  = 0.095. 


In part 6, the students had to statistically test the hypothesis that the population mean equals 1/φ. The answer was YES. Wow, scientific confirmation at last! Wait, wait. (We hurriedly switch to LaTeX because html-math is too clumsy.)

Aha, any number between 1.584 and 1.673 would pass the test. Among these: 5/3 (da Vinci's L/N, being 1.666...) and 50/31 (my very own L/N proposal, being 1.612...). Without the golden ratio humbug around for so long, nobody would ever consider choosing the silly number (√5+1)/2 for an empirical estimate.

Did you ever notice that arm span over body height (investigated here) is approximately π/3 (which is 1.04....)? Try it, π/3 may well pass the statistical test, and reveal yet another unexpected mystery of the human body! Want to switch from the φ-mystery to the π-mystery? just use the approximate equality (up to 0.001)

√φ = π/4


Q.E.D.

*


30 July 2016

Debunking golden ratio navels (1)

In his book The music of the primes Oxford professor of mathematics Marcus du Sautoy nicely collects in a single paragraph most of the golden ratio myths. Thus (p.27): 
Experiment reveals that a person's height when compared to the distance from their feet to their belly button favours the same ratio [i.e. the golden ratio].
It is not clear what 'favours' means, but it has a statistical flavour. So, let's investigate the (statistical) claim
N/L = φ

where L is body length, N the height of the navel, and φ=(√5-1)/2, approximately 0,61803... Sure enough, in the 19th century, when golden numberism was invented, the navel of "Man" was placed exactly there, but this proves nothing at all. Before that golden era, nobody seemed to have been aware of any role of φ outside mathematics, in human bodies no more than in architecture.

In his Vitruvian Man of 1487, da Vinci placed the navel geometrically, at a height which turns out to be roughly 6/10 + 1/160. But the general rule with Vitruvius commentators is: 6/10. Thus Cesariano in 1521 (verify it here), and likewise in 1572 (below, the whole book here).


A century later, in 1678, Samuel van Hoogstraten did so for both genders:


Van Hoogstraten even seems to have done some homework on the female body, because her legs are 7/15 long, while his are the good old Vitruvian 7,5/15. Navels remain unisex at 6/10 though.

Our last example (more could be given) is from Perrault's 1684 Vitruvius translation. The blue lines are ours and show that, again, the navel is exactly at 6/10 (gauge left, in Dix Parties, i.e. ten parts).


Dürer

Dürer was the first to decidely leave Vitruvian scholastics and enter real life, populated with non-Vitruvian men and women. His Four books on human proportion (1528, the entire book here, in German) are entirely devoted to he subject. We will restrict ourselves to the first book, because there the proportions are expressed in fractions of the body height, while in the remainder he switched to a less transparent system. The first book, then, contains detailed views of eleven persons, 5 men, 5 women and 1 young child. He calls the men A,B,C,D,E (ordered from fat to thin), the women A.i, B.i,C.i,D.i,E.i (also from fat to thin) and the child F. Of each person three views are provided: front, sideways and back, all marked with proportions. The vertical proportions are on the back views. They are given as fractions, e.g. 2/11, of the body height.  Numbers that are not recognisable as fractions are to be understood as denominators of fractions with numerator 1. Thus, '3' stands for '1/3'. Sometimes, fractions are to be added. For instance, '10 et 11' stands for '1/10 + 1/11'. Here is the part of man A that is relevant for our purposes.


"In der weichen" means "in the waist", and below it we find "Im nabel", "in the navel". Following Dürer from the top down, we find 1/10 + 1/11, then 2/11 and finally 1/40, adding up to 35/88. This means the height of the navel is 53/88, being 0,6022... , above ground level. We repeated this for the other 10 persons, and obtained the following table, in which we included the averages for the five men and the five women.


Where is the golden ratio? Dürer and da Vinci were perfectly aware of φ, because Pacioli's (entirely mathematical) book on the subject dates from 1498. Had they wanted, they could have used a simple geometrical construction to locate navels at height φ. As neither did, they must not have seen the point of it. Instead, Dürer uses a system in which the golden ratio cannot possibly show up, because φ cannot be written as a fraction. But perhaps golden numberists would settle for somewhat less, like one of the fractions constructed from Fibonacci's sequence

1, 1, 2, 3, 5, 8, 13, ...

 The terms divided by their respective predecessor give

1, 1/2, 2/3, 3/5, 5/8, 8/13, ...
 
and it is well known that this sequence converges (though not very fast) to φ. Nope, no fraction of the sort to be seen anywhere. In short: no golden ratio anywhere.

There is some doubt as to whether Dürer provides us with real measurements of real individuals, or artistically merged a bunch of data into a single 'average' person of a certain body type. (Read all about it here.) One reason for suspicion is that his proportions are given with exaggerated precision (for which, see next post). Anyhow, a sample of 11 is not statistically meaningful. But, it might not be accidental that the highest navel is found in the thinnest man, and the lowest one in the fattest woman. (Unless this reflects what Dürer was convinced a priori to be the case. The man has been caught on other occasions, see here.) 

For what it's worth: the overall crude impression from Dürer's proportions is, that navels of adults are situated slightly above 0,6 of their body height, higher in men than in women, and higher in thin persons than in fat ones. If the single child is taken into account, one could add: higher with age. [Italics not entirely justified.]

In his sample of ten, Dürer considers people whose height is 7, 8, 9 and then 10 times their head. Later theorists divide an 8-header vertically in 8 parts: top to chin, chin to nipples, nipples to navel and so on. In this scheme, the navel is placed 3/8 from the top, hence on height 5/8, which is 0.625. Among those who explicitely state this rule we find Samuel van Hoogstraten, who frames it in a didactical little poem (High School of Painting, p.57). Yet his 7,5-header (shown above) had a navel height of 3/5. So yes, it would seem that taller people were supposed to have higher navels.

In view of what arm length has revealed (here), it is not unreasonable to expect that statistical navel heights, duely measured, would turn out to depend on sex, race and age. At least, Dürer's 'findings' do not contradict that guess.


*

(continued here)

28 July 2016

Da Vinci and the Square Man

The Roman architect Vitruvius was the first to state some simple proportions supposed to exist in "the" human body. Some of his claims are blatantly wrong, and his rule "foot length = 1/6 of body height" was changed by da Vinci into the more reasonable 1/7. Some other claims, like "arm span = body height", seem very appropriate though, and many renaissance artists besides da Vinci have provided illustrations of the homo ad quadratum. The woodcut below is by Cesare Cesariano (1521 Vitruvius translation). 

Being unambiguous and easy to measure, the arm-span claim is perfect for investigation and, for once, we had an easy task finding scientific sources to quote from. Many well-documented studies are directly available on the internet—drag for "arm span, height'—, because there is some medical interest in deducing body height from other measurements. Arm length does prove to be the most reliable measurement to use, but the correlation turns out not to be 1:1.

Let's first agree that the claim is a statistical one. No one believes that "people" have feet 1/7 of their body height, because there are people with small feet and people with large feet. Likewise, there are people with short or long legs, with short or long arms. Sure enough, actual experiments result in a cloud of data, not in the platonic straight line y=x which would follow from exact and universal equality between the two measures. Moreover, due to the intrinsic limitations on precision, data are not points ("is equal to this number") but intervals ("lies between this number and that number"). Here (p. 40) an example from 2011, dealing with some 300 Nigerians, between 20 and 50 years old:
The experiments, which have been done worldwide, over decades, and for different sexes, races, ages and even for some very specific populations, agree on this: 
statistically speaking, arm span exceeds body height, to a degree which is highly dependent on sex and race, and somewhat dependent on age.
As early as 1987, a study of young women of two races revealed that, on average, arm span exceeded height by 1.8 cm for the white sample, and by 8.3 cm for the black sample (here and here). Meanwhile everybody agrees that a universal correlation is of no use, and that different formulas are required for the sexes and the races. A nice overview is to be found here (Table 1). There we also find the latest, and best documented, of the correlation formulas. For white males between 20 and 80 years old, body heigh H, arm span AS (both in centimeters) and age A (in years) are correlated by the formula

H = 54.1 + 0,70 AS - 0.08 A,

found to be in very close agreement (well, as good as it gets) with the actual measurements. (If Vitruvius were right, the formula would simply be H = AS.) 

To qualify as a model for da Vinci's Square Man, one must satisfy 

H = 54.1 + 0,70 H - 0.08 A,

i.e.
H = 180.33 - 0.26 A.

Plugging in A=20 and A=80, we find that only those between 1.59 m and 1.75 m stand a chance, and they have to apply at a very specific age: those of 1.75 m as early as 20, while professional models of 1.59 m have to wait until they're 80. All others would shamefully see their fingertips protrude from the square!

*


19 July 2016

Gulden Snede, Fibonacci en andere quatsch (4)


In deze aflevering verlaten wij de wiskunde en betreden schoorvoetend het terrein van de Kunsten. Bij Marcus du Sautoy, The music of the primes (2003, hier blz.27) lezen we
It [the golden ratio] encapsulates what many people down the centuries have regarded as perfect proportions. If you examine the canvases in the Louvre or the Tate Gallery, you'll find that very often the artist will have chosen a rectangle whose sides are in a ratio of 1 to 1,61803...
Tu quoque, Marce! Deze gereputeerde Oxford-professor wiskunde vertelt hier gewoon door wat iedereen 'weet', en wat iedereen wel ergens gelezen of gehoord heeft. Helaas is deze 'common knowledge' niet waar, en dat zullen wij hieronder aantonen. Bovendien heeft Marcus uit het overvloedige aanbod van quatsch de slechtst mogelijke keuze gemaakt, want al in de negentiende eeuw moest Fechner (een van de twee vaders van de gulden mythe) uit meer dan tienduizend schilderijen besluiten dat de gulden snede geen enkele voorkeur geniet qua verhouding. (Albert van der Schoot, De ontstelling van Pythagoras, tweede druk, 1999, p.263)

Onder de vele goed-gedocumenteerde kritische bronnen kiezen wij de volgende drie, omdat zij elk afgaan op eigen primair onderzoek.
  •  [SB] = H. Schiffmann and D. Bobko, Preference in linear partitioning: the golden section reexamined, Perception and Psychophysics, 24, No 1, 1978 (hier)
  •  [M] = G. Markowsky, Misconceptions about the Golden Ratio, The college mathematics journal, 23, No 1, 1992 (hier)
  •  [PM] = J. Putz and C. Morjan, Preference for the golden rectangle: a student/faculty research project, PRIMUS: problems, resources and issues in mathematics, XI, No 4, 2001 (hier)


Het waarnemen van getallen


In deze aflevering van de Gulden Saga noteren we

φ = (√5-1)/2 = 0,61803...

De vorige afleveringen gingen over wiskunde, maar dit keer dalen wij af in de echte wereld, want wij zullen het hebben over de esthetische smaak van 'de mensen'. Dit houdt in dat er experimenten gebeuren waaruit testresultaten voortkomen die statistisch verwerkt moeten worden. Getoetst wordt de hypothese dat het getal φ een bepaalde waarneembare eigenschap heeft. Bewijzen dat die hypothese waar is is eigenlijk onmogelijk. Elk fysiek experiment gebeurt immers met een bepaalde beperkte precisie, en resulteert dus niet in het is dit getal maar in het ligt tussen dit en dat getal. Onderstel eens dat een bepaald experiment oplevert: het ligt tussen 0,58 en 0,66 (dat zijn de tolerantiegrenzen die in [MJ] aanvaard worden voor φ). Wat dan nog? Als ik een π-mysticus was i.p.v. een φ-mysticus, dan zou ik het experiment triomfantelijk inroepen als bewijs dat hier 2/π 'gevonden' is. Dat getal is immers 0,6366... en ligt dus binnen de waarnemingen. Bovendien, 2/π komt veel vaker in de wiskunde voor dan φ, en heeft nog een 'echte' fysieke betekenis ook: het zwaartepunt van een halve cirkel met straal 1 ligt op die afstand van het middelpunt! Ik zou aan mijn π-geloof pas beginnen twijfelen als een nieuw experiment zou aantonen dat het resultaat tussen 0,617 en 0,619 ligt, en dan nog! Zelfs bewijzen dat iets meetbaars nul is is eigenlijk onmogelijk. Gelukkig voor ons kan men wel experimenteel aantonen dat iets niet φ is. Het volstaat dat de experimenten resulteren in: het ligt tussen dit en dat getal, en dat φ niét tussen die getallen ligt.


Het is niet φ


De pseudo-wetenschappelijke basis voor de gulden mythe is in Duitsland gelegd, in de 19de eeuw, door Fechner en Zeising. [PM] geeft een goede analyse van de methodologische fouten die door hen en hun navolgers begaan zijn. Daarop aansluitend wordt in [PM], zeer nauwkeurig, het nieuwe experiment beschreven waarbij die methodologische fouten vermeden worden. De 72 proefpersonen konden met muis en computer de rechthoek tekenen die zij het mooist vonden. De verhouding tussen lengte en breedte van de uitverkoren rechthoeken leverde het volgende histogram op:


Er zijn dus (statistisch gesproken) drie rechthoeken die de voorkeur wegdragen, en de intervallen voor de drie meestgeliefde verhoudingen zijn:
  • tussen 0,625 en 0,675
  • tussen 0,825 en 0,875
  • tussen 0,950 en 1,000 

De waarde 1 komt overeen met een vierkant, wat toegelaten was en overigens mijn keuze geweest zou zijn. Geen van de intervallen bevat 0,618... , en de conclusie is dan ook [PM, p.378]:

The results of this experiment do not support the golden section hypothesis.

Om het eens populistisch te stellen: 'de mensen' verkiezen rechthoeken die minder 'plat' zijn dan de z.g. 'gulden' rechthoek. Wie foto's maakt met een smartphone bevestigt dat dagelijks: het formaat is 2/3, wat groter dan φ is. Voor eenvoudige verhoudingen als 2/3 heeft het menselijk brein wél een voorkeur. Wie in die verhouding een snaar verdeelt kan een reine kwint laten klinken! 


Het is ongeveer φ, maar dat betekent niets


In teksten van golden numerologists ontmoet men vaak de bewering dat iets 'ongeveer de gulden snede' is. Dat is juist, want men kan de tolerantiegrenzen altijd zo rekken dat een bepaald getal erbinnen valt. In die zin kan men dus, zonder te liegen, beweren dat een bepaald resultaat, dat tussen 0,5 en 0,7 blijkt te liggen, 'bij benadering' een waarneming van de gulden snede is. Dat is o.m. gebeurd bij een onderzoek (Svensson, geciteerd in [SB]) dat dit interval oplevert, met een gemiddelde van 0,633. Wow! Dat is ei zo na mijn 2/π!

De grafische tegenhanger hiervan is, dat men op een figuur de gulden snede aanbrengt met voldoende dikke lijnen. Klopt ook altijd (vooral als de figuur maar 'in grote lijnen' erin past) en betekent absoluut niets. Elk kunstwerk krioelt van verhoudingen die ongeveer 2/3 (en dus ook ongeveer φ) zijn.


 Andere experimenten

Er zijn methodologische bezwaren in te brengen tegen experimenten waarbij proefpersonen moeten kiezen uit een aantal rechthoeken die hun voorgelegd worden. De keuze is beperkt, de lievelingsrechthoek zit er misschien niet tussen, de volgorde van presenteren kan een rol spelen enzovoort. In elk geval, [M, p.15] komt ook bij dit soort experimenten tot de conclusie

The various claims about the esthetic importance of the golden ratio seem to be without foundation.

Hij stelde ook vast dat de meeste mensen geen verschil zien tussen rechthoeken waarvan de verhoudingen maar weinig verschillen, en dat zij niet in staat zijn de 'gulden' exemplaren eruit te pikken. Bij hem werd het meest gekozen de rechthoek met de totaal banale verhouding 0.546! Samen met de drie van [PM] zitten we daarmee al aan vier 'lievelingsrechthoeken'. Misschien is het gewoon zo dat er geen universeel-menselijke smaak voor rechthoeken bestaat noch ooit bestaan heeft. Voor lijnstukken lijkt dat in elk geval zo te zijn. Er is nochtans a priori meer reden om 'iets' te verwachten voor lijnstukken dan voor rechthoeken. Als men een lijnstuk verdeelt door er een punt op te plaatsen ziet men de drie ingrediënten van de gulden snede (het kleinste stuk, het grootste stuk en het oorspronkelijke lijnstuk) ook echt staan, netjes op een rij. (Bij een rechthoek ziet men er maar twee, haaks op elkaar.) Jammer voor de mythe, maar helaas! De experimenten met lijnstukken leveren op [SB, p. 102]
The results do not demonstrate a preference for the golden section or a preference for any other ratio.
We mogen stilaan afronden, denk ik. Men zegge het voort:

het menselijk brein heeft geen voorkeur voor de gulden snede.


Dit betekent niet dat men de gulden snede niet echt kan aantreffen in producten van de menselijke geest. De architect Le Corbusier, bijvoorbeeld, heeft haar (onder invloed van Matila Ghyka en diens gratuite beweringen) als maatstaf gebruikt. (Meer over de rol van Le Corbusier hier.) Dit zijn cerebrale ingrepen, zoals Bach het muzikaal motief B-A-C-H gebruikt heeft, en zoals het 'e-rondeel' gebaseerd is op de decimale ontwikkeling van het getal e. In al deze gevallen is de keuze gemaakt niet omdat het zo mooi is, maar gewoon als vormgevend element, één keuze naast vele andere die even goed zouden zijn. Kunstenaars kunnen er ook (onterecht) van overtuigd zijn dat de gulden snede garant staat voor diepe schoonheid, en haar vanuit dit misverstand bewust toepassen, waarmee zij de zaken als het ware op hun kop zetten.

Toegevoegd 15 maart 2018. Een mooi voorbeeld van het laatstgenoemde fenomeen vinden we in A New Kind of Science van Stephen Wolfram, blz. 891:


We treffen er de onjuiste bewering aan dat de Gulden Snede al sedert de oudheid een schoonheidsideaal was, onmiddellijk gevolgd door de mededeling dat het computeralgebraprogramma Mathematica die gulden verhouding als standaard gebruikt. Er zou geen reden voor die verhouding zijn als Wolfram niet (valselijk) geloofde hiermee een grote traditie te voort te zetten!

(Wordt vervolgd met Nog Meer Quatsch)


14 July 2016

De avonden (Reve, 1947)


Mijn exemplaar van De Avonden dateert van 1982, en in dat jaar heb ik er een tiental bladzijden in gelezen. Ik weet dat met zekerheid, want ik turfde hoeveel keer 'mompelde hij' voorkwam, en het resultaat schreef ik onderaan elke bladzijde. Ik heb het boek toen dichtgeklapt en beschreef het in april 2016 (hier) nog als onnoemlijk saai. Omdat ik mijn uitpuilende boekenplanken wil ontdoen van onleesbare ballast heb ik De Avonden recent opnieuw ter hand genomen. En ziet! Ik heb het geboeid doorgelezen en kort daarop een tweede keer even geboeid doorgelezen. Daarna heb ik mij over 'wie is wie' en 'wat is er van aan' gedocumenteerd in de zeer uitvoerige biografie De vroege jaren. Ik zal verderop de verwijzingen naar Maas aangeven met M gevolgd door de bladzijde.

Het minste wat ik nu van De avonden kan zeggen is, dat ik in het Nederlands niets ken dat ermee te vergelijken valt. Ja, natúúrlijk heb ik gezien dat Brusselmans met zijn debuut De man die werk vond er een epigoon van is. Ik had mij al eerder gerealiseerd dat Brusselmans zijn gimmick van de archaïsche stadhuistaal—u weet wel, oudehoeren over het wederbericht en zo—aan Reve ontleend had, maar met De Avonden lag ook the smoking gun voor. De man die zijn werk beschrijft als Ik neem kaarten uit een bak. Als ik die er uit genomen heb, dan zet ik ze er weer in, is dat Frits van Egters bij Reve of Louis Tinner bij Brusselmans? Het staat bij Reve, maar dat het bij Brusselmans niét staat kan ik niet volledig garanderen, want ik heb hem bij het opruimen van mijn boekenplanken tweedehands verpatst. (Ik heb daar nu al spijt van.)

Maar buiten het Nederlands taalgebied had ik wél associaties, en niet van de geringste. Ik dacht aan niemand minder dan James Joyce. De armtierige lotgevallen van Frits van Egters in Amsterdam van 22 tot 31 december 1946 (10 dagen, maar met het kantoorleven eruitgeknipt) zijn even precies beschreven als die van Leopold Bloom in Dublin op 16 juni 1904 (1 etmaal). In beide gevallen is er zeer veel oog voor details (welk weer is het, waaruit bestaat de maaltijd, hoe laat is het, welke weg neemt het personage, enz.) en is er zeer veel monologue intérieur. Dat er bij Reve voortdurend gemompeld wordt en bij Joyce niet ligt hieraan, dat Frits zijn inwendige gedachten onmiddellijk laat volgen door daden of woorden die ermee in tegenspraak zijn. Dan is er natuurlijk een scheiding nodig tussen het inwendige en het uitwendige, en daar dient dat eindeloze gemompel voor. Bij Reve is ook niets te merken van de stijlexperimenten die Ulysses maken tot wat het is. De stijl van Reve is zoals zijn leraar Nederlands het ze geleerd had: helder, beknopt en ondubbelzinnig [M87].

Zijn waarneming van gebeurtenissen en personen is fotografisch en vlijmscherp, en het lijdt geen twijfel dat alles naar het leven getekend is. Na Mort à crédit was Céline persona non grata bij de geportretteerde familieleden, en men zou hetzelfde kunnen verwachten bij Reve, die zijn ouders voorstelt als onbenullig, totaal voorspelbaar en vooral dodelijk saai. De werkelijkheid was wel enigszins anders. Gerard van het Reve senior was een journalist in dienst van de communistische beweging, en hij wordt eervol vernoemd zowel in het katholiek Lectuurrepertorium (hier of hier) als in het Biografisch Woordenboek van het Socialisme en de Arbeidersbeweging in Nederland (hier.) Hij heeft Dickens vertaald, heeft onder zijn eigen naam en onder diverse pseudoniemen kinderboeken, verdienstelijke romans en zijn memoires geschreven, en is in Rusland, Spanje en Duitsland actief geweest. Hij was een goedhartige opschepper, die zijn vrouw ongelukkig maakte door zijn 'veelwijverij'; een allemansvriend, die nooit om een verhaal of een grapje verlegen zat [M23]. Zij was een zorgzame en zorgelijke moeder, intelligenter dan ze zich voordeed [M24]. Het hele gezin was toen (1947) militant communist. Het was er een va-et-vient (geweest) van verdwaalde en voortvluchtige communisten, en vader Gerard was er al eens vandoor geweest met een mooie partijgenote.

In 1947, het jaar van De Avonden: (v.l.n.r.)
moeder, Gerard jr., het gezinnetje van broer Karel, vader.
Er is dus wel enige discrepantie tussen het werkelijke gezin en diens suffe literaire tegenhanger. Typisch voor de echte verhoudingen is, dat Reve zijn ongepubliceerde hoofdstukken aan zijn ouders liet lezen. Ze waren niet erg enthousiast [M223] maar hebben daar, anders dan bij Céline, geen blijvende rancunes aan overgehouden. Dat strekt vooral de vader, die letterlijk in zijn hemd resp. te kakken gezet wordt, tot eer. In De avonden is overigens geen sprake van enig direct conflict, behalve dan het achtergrondgevecht tussen de echtelieden. Frits werkt netjes op kantoor—de echte Reve was toen journalist bij Het Parool én in psychiatrische behandeling—en woont braafjes thuis, weliswaar cynisch mompelend, maar toch steeds beleefd en gedienstig. Het communistisch activisme is totaal afwezig, seks eveneens. Dat laatste is opvallend, want zowel het personage als de auteur waren 23 jaar, en de laatste was een obsessionele masturbant. Hij had ook al een verloving achter de rug die verre van platonisch was geweest, en zou het jaar na De Avonden trouwen met Hanny Michaelis. De homoseksualiteit, die zijn latere werk en leven zou domineren, werd eerst in 1950 voor derden merkbaar [M325], en na elf jaar werd zijn huwelijk ontbonden. Nu, van Reve heeft niemand ooit geweten wat 'echt' en wat 'gespeeld' was, en dat geldt voor zijn communisme, zijn katholicisme, zijn homoseksualiteit, zijn plechtig taalgebruik—kortom voor alles.

Reve met zijn vrouw
Louter literair heb ik maar twee punten van kritiek. Droomscènes in boeken en films komen mij altijd zeer gratuit voor, en het is hier niet anders. Ja, we leren iets over het getormenteerde brein van Frits, maar hebben we daar die vele uitgebreide dromen voor nodig? Ik heb die passages alvast aangeduid om ze bij een derde lectuur over te slaan. Het toppunt is nog: de meeste van die dromen zijn niet eens aan het brein van Reve ontsproten, maar werden hem door zijn vrienden op zijn verzoek toegeleverd! [M226] Men leest dan ook met enig leedvermaak dat 'onderzoekers hun tanden stukgebeten hebben op de interpretatie van de dromen in het boek' [M275]. En dan: het boek bevat twee (Nederlandse) zinnen waar dan bijgezegd wordt dat ze in het Engels waren. Tja, waarom staan er niet gewoon twee Engelse zinnen? Het antwoord: Reve was een taalpurist; in De Avonden vernoemt hij ook enkel de vertaalde titels van films en muzieknummers.

De latere Reve zou zich ontpoppen tot een van die schaarse (Noord-)Nederlandse schrijvers met een zeker gevoel voor het geslacht van de woorden. Op dat (ene) punt had hij in De Avonden nog alles te leren. Sigaar, sigaret, hand (een taaie), pijp, vaas, snee, krant, deur (de taaiste), kaart, muziek, kom, kist, doos, kit, vork, gedachte, plaat, maan (hoe bestaat het!), al deze vrouwelijke woorden zijn bij de Reve van toen mannelijk. Voorts wisselt hij het correcte laten wij af met het incorrecte laat ons, en gaat hij (zoals alle Nederlanders) gebukt onder het dubbel-op weer terug. Systematisch treffen we bij tafel aan, waar iedereen toch zou zeggen bij de tafel. Het boek is ook een oerwoud van overbodige komma's, waarvan sommige zelfs de bedoelde betekenis omdraaien. Zo lezen we dat Frits van het kantoor, waar hij werkte, naar huis reed. Bedoeld is natuurlijk het kantoor waar hij werkte.

Terug naar de lof. Ik vond de spanning tussen de cynische Frits en zijn uitwendige gedragingen zeer intrigerend. Iedereen uit zijn omgeving zegt en herhaalt dat ze nooit weten of hij het ernstig bedoelt of niet. Toch heeft hij echte emoties, en de zin Hij voelde zijn ogen vochtig worden komt bij herhaling terug. Ook zijn gevoelens tegenover zijn ouders, waaronder medelijden niet het geringste is, lijken echt, ondanks hun cynische inkleding. Literair was ik het meest onder de indruk van de bijbelse aansprekingen van God naar aanleiding van alledaagse gebeurtenissen. In de oudejaarsnacht gaat Frits vruchteloos langs bij zijn vrienden Jaap, Viktor en Louis, waarvan niemand thuis is. Bij de deur van Louis gaat het als volgt.

'Nu bel ik aan. Almachtige God, zie mijn benauwdheid. Dit is de laatste deur.'

Hij hield de knop vijf tellen lang ingedrukt en wachtte. 'Niemand,' zei hij, 'Niemand.' Hij belde opnieuw aan, trad achteruit en bleef voor de portiek staan. 'Niet thuis, die zak,' mompelde hij, 'Hier sta ik.' Hij begon naar huis te lopen.

'Uit de diepten heb ik geroepen,' zei hij bij zichzelf, 'maar mijn stem is niet gehoord. Bessen-appel. Nu ga ik op op weg naar huis. Eeuwige, enige, onze God, ik ga naar mijn ouders. Zie mijn ouders.' Zijn ogen werden vochtig.

'Eeuwige, enige, almachtige, onze God,' zei hij zacht, 'vestig uw blik op mijn ouders. Zie hen in hun nood. Wend uw blik niet af.'

Geweldig, toch?

Als uitsmijter, een afwijkend geluid over De Avonden: wat is het allemaal toch voor gezeur, en erg primitief geschreven. Aldus het oordeel van... de auteur [M223].


*